Using the WordPress Debug Bar Plugin

It’s Friday afternoon. 4:30pm. Suddenly your new email indicator lights up. A client you haven’t spoken to in months says:
“I’ve been getting reports that my site is running really slowly. Could you take a look?”
Ever been there? Ever spent a weekend reading through code you wrote, and then code you didn’t write, looking for what could possibly be slowing things down?
The Debug Bar plugin for WordPress can help developers analyze slow sites, as well as solving several other problems.
Installing the Debug Bar
Debug Bar is in the WordPress Plugin Repository so you can install it in the usual way.
Once it’s installed, go to the front of your web site, and you should see a Debug link in the Admin Bar at top of the site:

When you click it, it will open a layered window. It may have a notice to turn on WP_DEBUG. If so, then you need this bit of code in your wp-config.php file:
define('WP_DEBUG', true);Note that this line may already be there, but set to false. If that’s the case, simply set it to true.
Using the Debug Bar
This video introducing the Debug Bar is part of our class on the Developer Plugin:
Using the Debug Bar to Fix a Slow Site
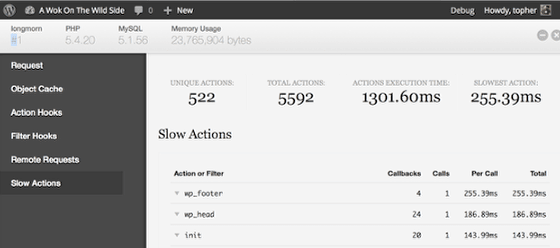
In this screenshot above you can see some tabs on the left. The object cache shows you what has been cached and how big those things are. The Action Hooks and Filter Hooks tabs show you all the hooks that were used in the loading of this page. The Remote Request tab tells you about things that were fetched from remote servers, how long it took, etc.
The tab we’re looking at here shows Slow Actions. I don’t actually have any REALLY slow actions on my site, but you can see that it orders them by speed. The site that I’m running this on has 4 widget areas in the footer, each of them doing something a little complicated, so wp_footer is taking the longest.
When looking at a mysteriously slow site, and you’ve ruled out large images, the next best thing to look at is slow queries. Quite often you’ll see that there’s a specific query that’s running super slow.
Query Monitor is another plugin that does an excellent job tracking slow queries. It can be a lot more specific about where the queries are and what they’re doing, so once you suspect it’s a database issue, I suggest using this plugin.
Addons for the Debug Bar
Once the Debug window is open you should see some info at the top like PHP version, MySQL version, and Memory Usage. It’ll also show information about the http request that was made to get that page. That’s not a ton of information, but happily the Debug Bar is intended to be extended. It can do many many things, but rather than do everything, forcing you to deal with things you don’t care about, you get to pick and choose.
Search the WordPress Plugin Repository for Debug Bar and you should see many dozens of add ons that allow you to get specific pieces of information about your site.

Here’s another video from the Developer Plugin class. This video covers the Debug Bar Cron addon: